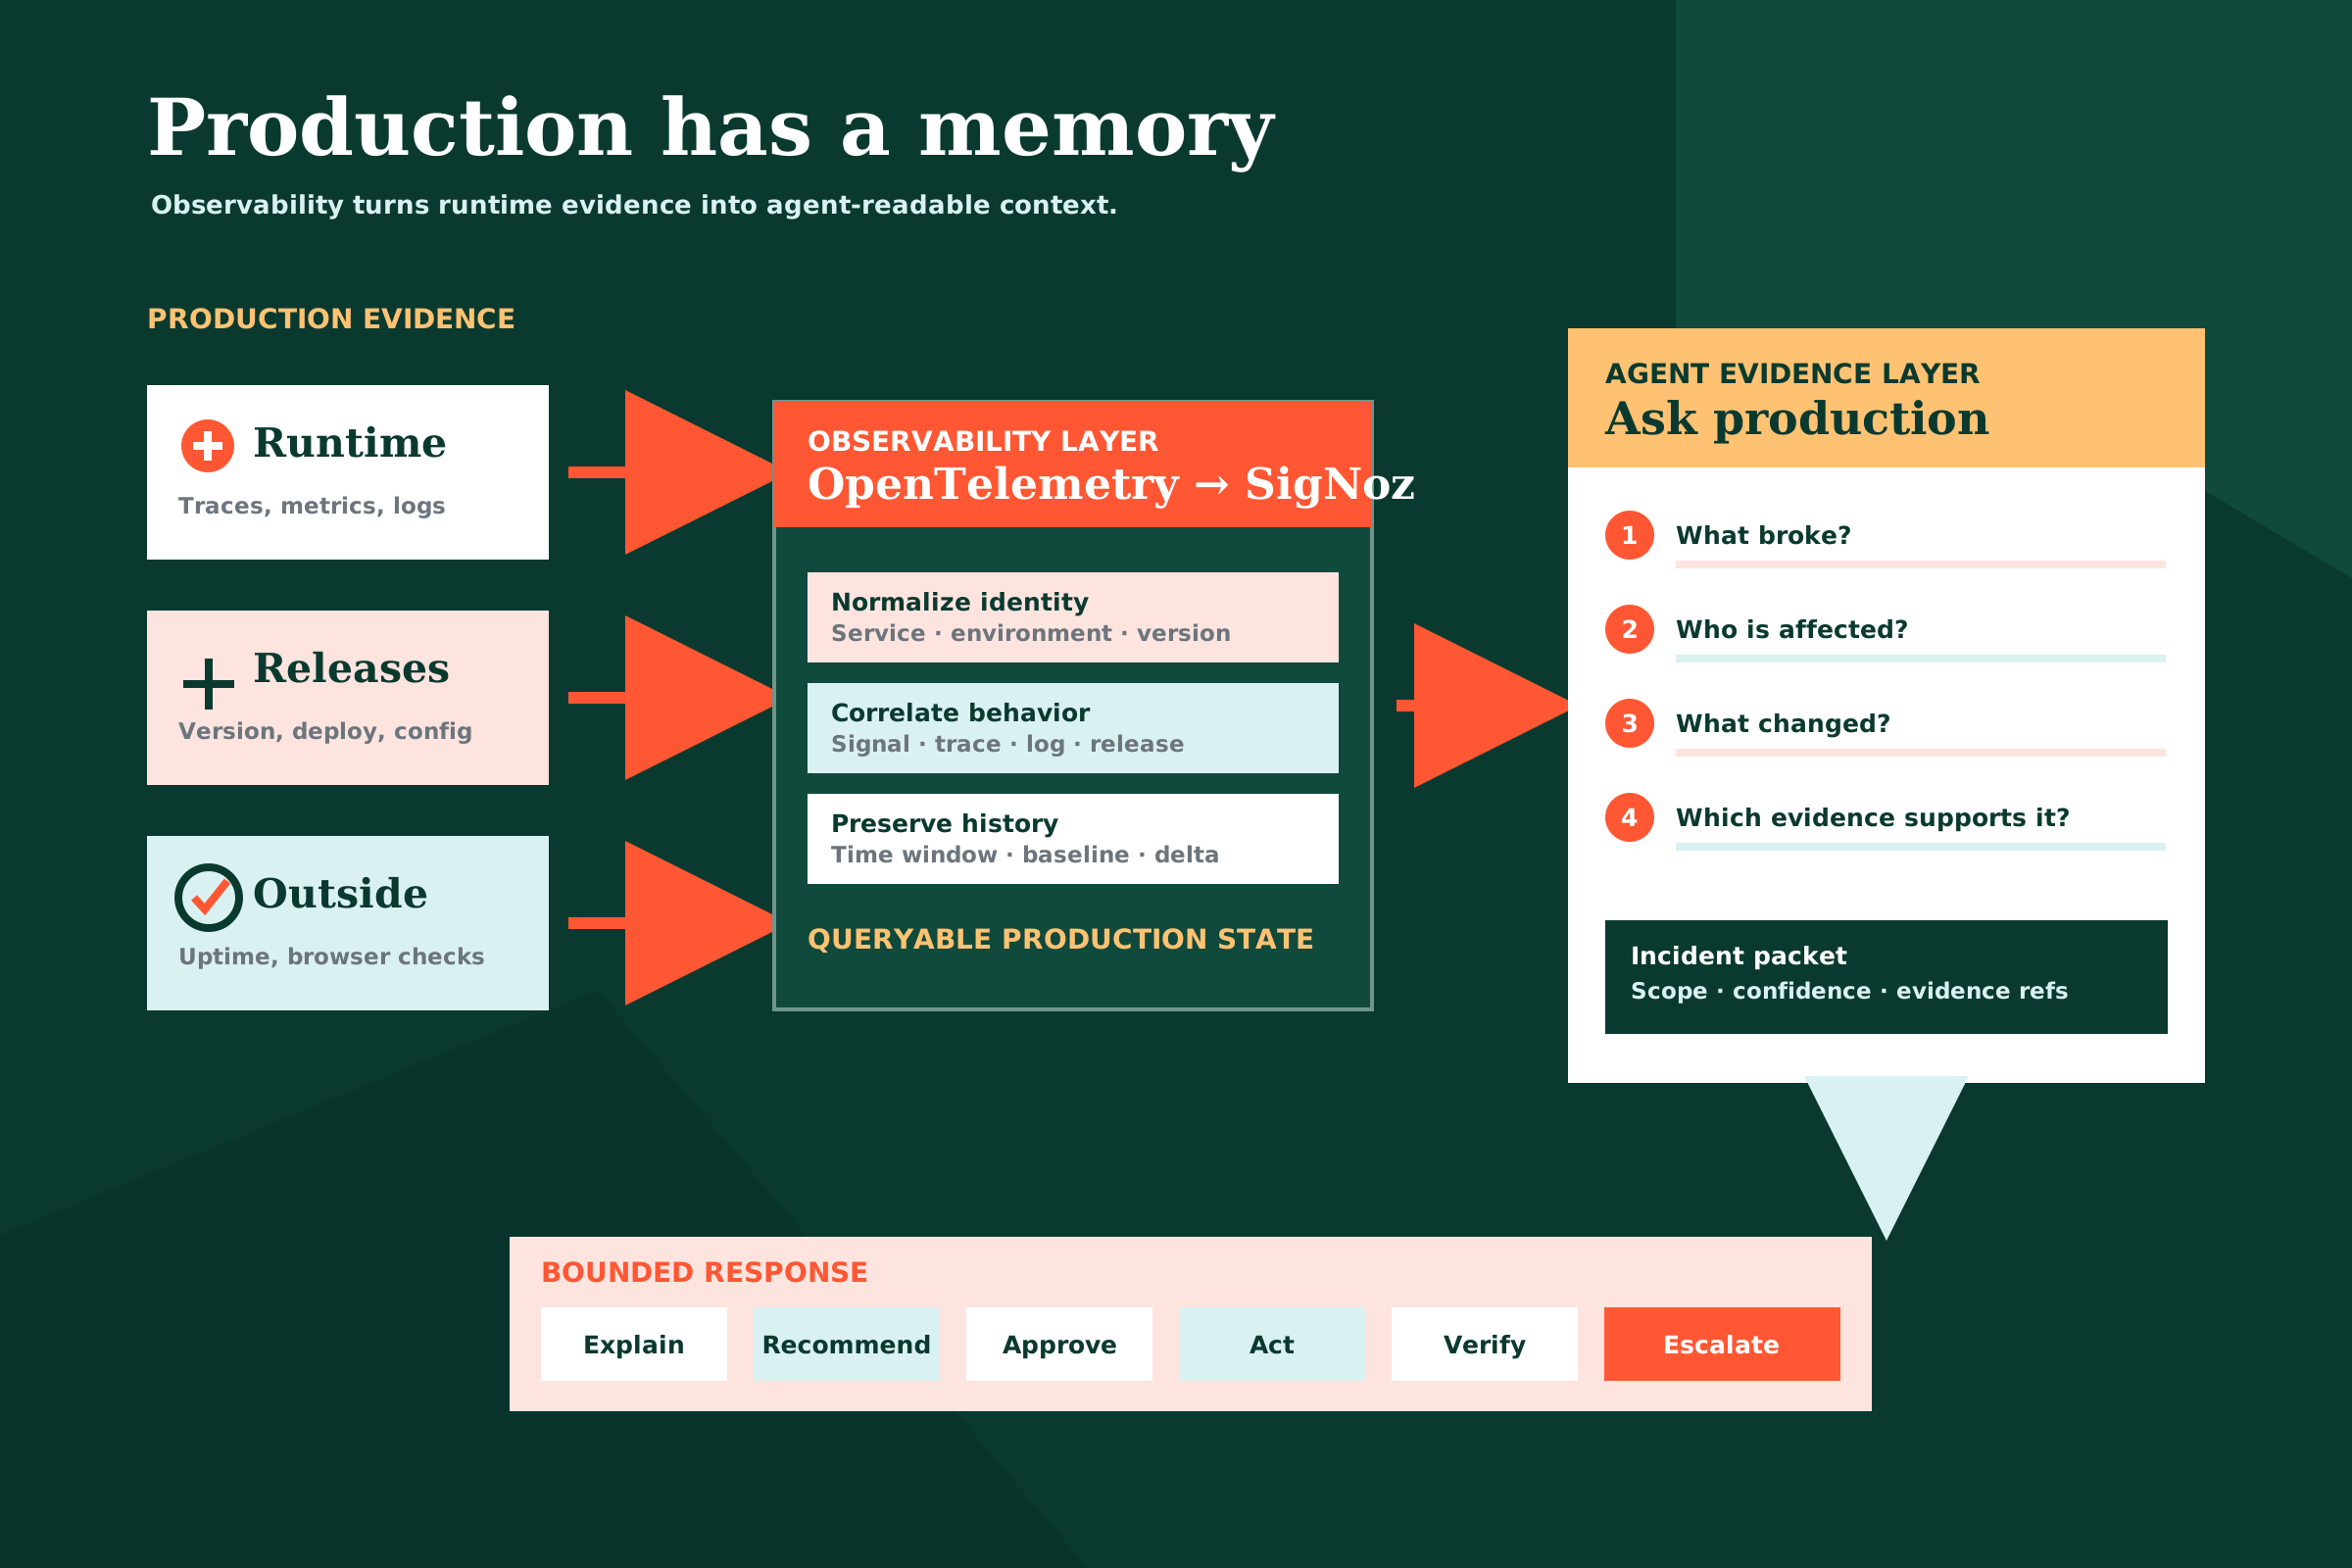
I am working toward a deliberately aggressive operating target: keep production uptime as close to 100% as possible through prompting.
The phrase needs one qualification. A prompt does not keep a service alive by itself. Instrumentation, health checks, deployment controls, backups, and rollback paths still do the work. “Prompting only” describes the operator surface: I should be able to ask whether production is healthy, receive an evidence-backed answer, and initiate an appropriate response without manually moving between five dashboards and three terminals.
That matters during founder-led go-to-market work. A founder already has enough customer state to manage in a CRM. Production should not require a parallel career of watching graphs, refreshing pages, and reconstructing incidents from scattered logs. The system should bring a compact explanation to the operator when something needs attention.
The missing piece is not another agent. It is another data layer for the agents we already have.
The blind spot in most agent context
Software agents are usually given some combination of:
- the source repository;
- product documentation and runbooks;
- deployment history;
- a CRM or support system;
- shell and infrastructure tools; and
- a browser through Playwright or a similar automation layer.
That is a useful set of capabilities. It is still incomplete.
The repository tells the agent what the software is intended to do. Git tells it what changed. The CRM tells it which relationships matter. A browser test tells it whether a user journey works at the moment the test runs. None of those sources, by itself, provides a durable account of what the running system has been doing across requests, services, workers, queues, and deployments.
Production has its own state. That state lives in traces, metrics, logs, exceptions, resource signals, uptime checks, and release markers.
Without that layer, an agent investigating a live problem is forced to behave like a person standing outside a building. It can try the front door. It can look through a few windows. It can inspect the blueprints. It cannot see that a pipe began leaking twenty minutes after the last renovation.
A live site is a surface, not a history
Browser automation remains useful. Playwright’s assertions can repeatedly check visible state until an expected condition passes or times out. That makes it a strong black-box probe for critical journeys such as sign-in, signup, payment, or form submission.
But a browser is mainly a view of the current surface.
It may show that checkout failed. It does not necessarily show that the payment service began timing out after version 1.8.4, that retries tripled queue depth, or that failures are isolated to one region. Reproducing the issue through a browser can also be expensive, slow, or impossible when the failure is intermittent.
Observability supplies the missing white-box evidence. Google’s SRE guidance makes the distinction cleanly: black-box monitoring is symptom-oriented, while white-box monitoring uses internal instrumentation to expose failures, including imminent problems and failures hidden by retries. It also separates the question what is broken? from why is it broken? (Monitoring distributed systems).
An effective production agent needs both views:
Browser and uptime checks -> What can the user experience right now?
Observability            -> What did the system do, where, and since when?
The browser should confirm important symptoms. It should not be forced to serve as the entire production memory.
Treat telemetry as a production knowledge layer
I recently wrote about building an open-source Datadog with OpenTelemetry, SigNoz, external uptime checks, and webhook alerts. That architecture creates the collection and storage loop. The next step is to make the evidence safely consumable by agents.
The layers then look like this:
| Data layer | What it can tell an agent |
|---|---|
| Repository and documentation | What the system is supposed to do |
| Git and deployment history | What changed and when it reached production |
| CRM and support state | Which customers and commercial relationships may be affected |
| Browser and external checks | Which user-visible paths are failing now |
| Observability | What the runtime did across time, services, and dependencies |
| Runbooks and controlled tools | Which responses are permitted and reversible |
Observability is different from a normal knowledge base. It is continuously produced by the running system. It records behavior rather than intention.
That makes it especially valuable to an agent. A model can already read source code and reason about possible failure modes. Telemetry lets it test those hypotheses against production evidence.
Give the agent questions, not a firehose
Connecting an agent to every log line is not the architecture. It is a way to create an expensive, noisy prompt.
The agent needs a narrow query interface over normalized evidence. For each incident, it should move through a stable sequence:
- Detect the symptom. Did availability, latency, error rate, traffic, or saturation move outside its expected range?
- Establish scope. Which environment, service, endpoint, region, version, and customer cohort are affected?
- Find the delta. What deployment, configuration change, dependency behavior, or traffic shift aligns with the start of the problem?
- Follow the causal path. Which traces and correlated logs explain the failing request or job?
- Choose a bounded response. Observe, recommend, retry, disable a flag, roll back, or escalate.
The four golden signals—latency, traffic, errors, and saturation—are a useful first index because they compress a large telemetry estate into a small set of operational questions. The agent can then drill into traces and logs only where the signals point.
This is retrieval over production state, but it should not be treated like ordinary document retrieval. Time windows, aggregations, baselines, release boundaries, and correlation identifiers matter. Asking for the ten semantically closest log lines is usually less useful than asking:
Which production services had a sustained error-rate increase in the fifteen minutes after the latest release, and which trace patterns account for most of that change?
The unit of context should be an incident packet, not a pile of raw events.
{
  "observed_at": "2026-08-28T14:05:00Z",
  "symptom": "signup completion fell below the service objective",
  "scope": ["production", "signup-api", "version 2.3.1"],
  "started_at": "2026-08-28T13:47:00Z",
  "recent_change": "deployment 9 minutes before onset",
  "evidence_refs": ["metric-query-42", "trace-group-17", "release-2.3.1"],
  "confidence": 0.86,
  "proposed_action": "roll back signup-api to 2.3.0",
  "rollback_available": true,
  "approval_required": true
}
The references are as important as the summary. An agent should show which query, trace group, or release marker supports its conclusion. That makes the diagnosis reviewable and gives the next agent—or a human operator—a path back to the underlying evidence.
OpenTelemetry makes the layer legible
An observability backend is useful to agents only when the telemetry has consistent identity.
OpenTelemetry semantic conventions define shared names across traces, metrics, logs, profiles, and resources. At minimum, every signal should carry a stable service name, environment, and release version. Trace and correlation identifiers should connect a failed user action to the services and logs involved.
service.name=signup-api
deployment.environment.name=production
service.version=2.3.1
This looks like infrastructure housekeeping. It is actually the grammar of the agent data layer. If one service calls production prod, another calls it live, and half the workers are named unknown_service, the model must guess which events belong together. No amount of prompting repairs a missing data contract.
Business context can be added carefully. A trace might include a plan tier, workflow type, or pseudonymous tenant reference when that context is necessary to establish impact. It should not casually copy email addresses, tokens, prompt contents, or full request bodies into telemetry. The agent needs enough customer context to rank impact, not a second uncontrolled CRM hidden inside the log store.
SigNoz can become the evidence interface
For a self-hosted stack, SigNoz is interesting because it already centralizes OpenTelemetry traces, metrics, and logs. The same store used for dashboards and alerts can support structured agent queries.
This direction is now explicit in the tooling. SigNoz documents an MCP server through which agents can query metrics, traces, logs, alerts, and dashboards, including for self-hosted editions. That removes much of the custom glue required to prove the model.
The existence of an MCP endpoint is not the whole design, however. The important choices remain local:
- which telemetry an agent may query;
- which time ranges and environments are available by default;
- how sensitive fields are redacted;
- which queries are saved as known-good operational probes;
- how evidence is cited in an incident summary; and
- which production actions, if any, the agent may request.
I would begin with read-only access. Let the agent answer production questions and assemble incident packets before it receives any actuator.
Detection, diagnosis, and action are separate permissions
The phrase “self-healing” often compresses three different jobs into one:
Detection -> Diagnosis -> RemediationThey should be earned separately.
An agent can be excellent at detecting an abnormal error rate and still be wrong about the cause. It can identify the likely cause and still select an unsafe repair. Giving a model deployment credentials because it summarized a trace correctly once is not reliability engineering.
I prefer an action ladder:
- Read and explain. Query production and assemble an evidence-backed incident packet.
- Recommend. Propose an action, expected effect, verification query, and reversal path.
- Execute with approval. A person approves a specific, logged, reversible operation.
- Auto-execute narrow remediations. Only well-tested actions with explicit limits graduate to automatic execution.
- Escalate uncertainty. Novel, destructive, security-related, or low-confidence cases go to a person.
A safe automatic action might restart one unhealthy stateless worker after an independent health check confirms the condition. A database migration rollback is not in the same class. Permissions should reflect that difference.
Every action also needs a verification query. The loop is not complete when the command returns successfully. It is complete when user-visible health and internal telemetry recover—or when the action is reversed and escalated.
Why this matters for founder-led GTM
Uptime is part of go-to-market execution because early customers experience the company and the product as one thing.
During founder-led sales, a production failure creates several simultaneous jobs: identify the problem, estimate customer impact, communicate accurately, repair the service, and preserve the commercial relationship. Without a shared evidence layer, the founder becomes the router between engineering telemetry and customer context.
The CRM already knows who the users are, which accounts are in a pilot, and which conversations are commercially sensitive. Observability knows whether those users’ workflows are succeeding. The useful system joins those sources only when needed and with controlled identifiers.
That enables better prompts:
- Are any active pilot accounts affected by the current signup failure?
- Did the last release degrade the workflow I am demonstrating today?
- Which errors are user-visible, and which are being recovered by retries?
- Has the proposed rollback restored the journey that failed?
- Does this incident require customer communication, or did it remain inside the error budget?
The goal is not to have an agent invent comforting status updates. It is to give the founder a fast, sourced answer while attention remains on customers.
A practical first implementation
The minimum credible version is small:
- Instrument one critical user journey with OpenTelemetry.
- Attach
service.name, deployment environment, release version, and correlation identifiers consistently. - Send traces, metrics, and redacted logs through a Collector to a central SigNoz installation.
- Add an external uptime check outside the application’s failure domain.
- Give an agent read-only access to a narrow set of production queries.
- Define an incident-packet schema with evidence references, confidence, impact, and a proposed next action.
- Test canonical prompts against known incidents and controlled failures.
- Add one reversible, approval-gated remediation only after the diagnosis path is dependable.
The first useful prompt can be simple:
Check the production signup journey for the last thirty minutes. Compare current health with the prior twenty-four-hour baseline and the latest deployment. Return the symptom, scope, likely change, supporting traces, customer impact if known, and the safest reversible next action. Do not change production.
Then cause a controlled failure and grade the result. Did the agent notice? Did it find the right service? Did it cite the right evidence? Did it distinguish correlation from cause? Did it recommend an action within policy? Did it verify recovery?
Those evaluations matter more than whether the first demo feels fluent.
Prompt-addressable uptime
No observability stack guarantees 100% uptime. Neither does an agent. Dependencies fail, networks partition, disks fill, certificates expire, and perfectly reasonable changes interact in unreasonable ways.
The achievable gain is a shorter and more reliable loop:
Production behavior
        ↓
Structured telemetry
        ↓
Agent-readable evidence
        ↓
Bounded response
        ↓
Verified recovery
That reduces unobserved failure time, diagnosis time, and the amount of founder attention required to coordinate a response. It makes high availability more compatible with a small team.
The key shift is to stop treating observability as a destination for human dashboards. It is a continuously updated account of reality. Once that account has a stable schema, a safe query surface, and evidence references, it becomes one of the most valuable data layers an agent can consume.
Source code tells the agent what we built. The browser tells it what one user can see. Observability tells it what production has actually been doing.
That is the net I want under a prompt-driven company.