Datadog looks like a dashboard, but the dashboard is only the visible surface.
Underneath it is a system that collects telemetry from applications and servers, stores it, connects related events, evaluates alert conditions, and routes incidents to people. Replacing Datadog therefore does not mean finding another set of charts. It means rebuilding that operating loop with open components.
The simplest credible starting stack is:
- OpenTelemetry for instrumentation and collection;
- SigNoz Community Edition for storage, querying, dashboards, and threshold alerts;
- an external uptime monitor for failures that cannot report themselves; and
- a webhook-connected messaging or incident channel for human notification.
This creates a self-hosted observability platform without asking a small team to recreate Datadog from scratch.
Decompose Datadog before replacing it
Datadog combines several jobs that are easy to confuse:
| Job | Open-source replacement |
|---|---|
| Application instrumentation | OpenTelemetry SDKs and zero-code instrumentation |
| Telemetry collection | OpenTelemetry Collector |
| Application performance monitoring | SigNoz |
| Logs, metrics, and traces | SigNoz backed by ClickHouse |
| Host and container monitoring | OpenTelemetry host, Docker, Kubernetes, and Prometheus receivers |
| Dashboards and threshold alerts | SigNoz |
| Human notification | Webhooks to a chat or incident channel |
| External availability checks | Uptime Kuma or Prometheus Blackbox Exporter |
| Continuous profiling, if required | Grafana Pyroscope |
The optional components should remain optional. A small team should not deploy six databases merely to avoid paying one vendor. Start with a unified backend, then add a specialized component only when a demonstrated requirement justifies it.
This is also where the phrase “open-source Datadog” needs a boundary. It does not mean reproducing every security, network, browser-testing, profiling, and incident-management product Datadog sells. It means reproducing the production feedback loop your team actually uses.
The architecture
One central observability installation can monitor many applications. It is not a one-to-one relationship.
Applications ─┐
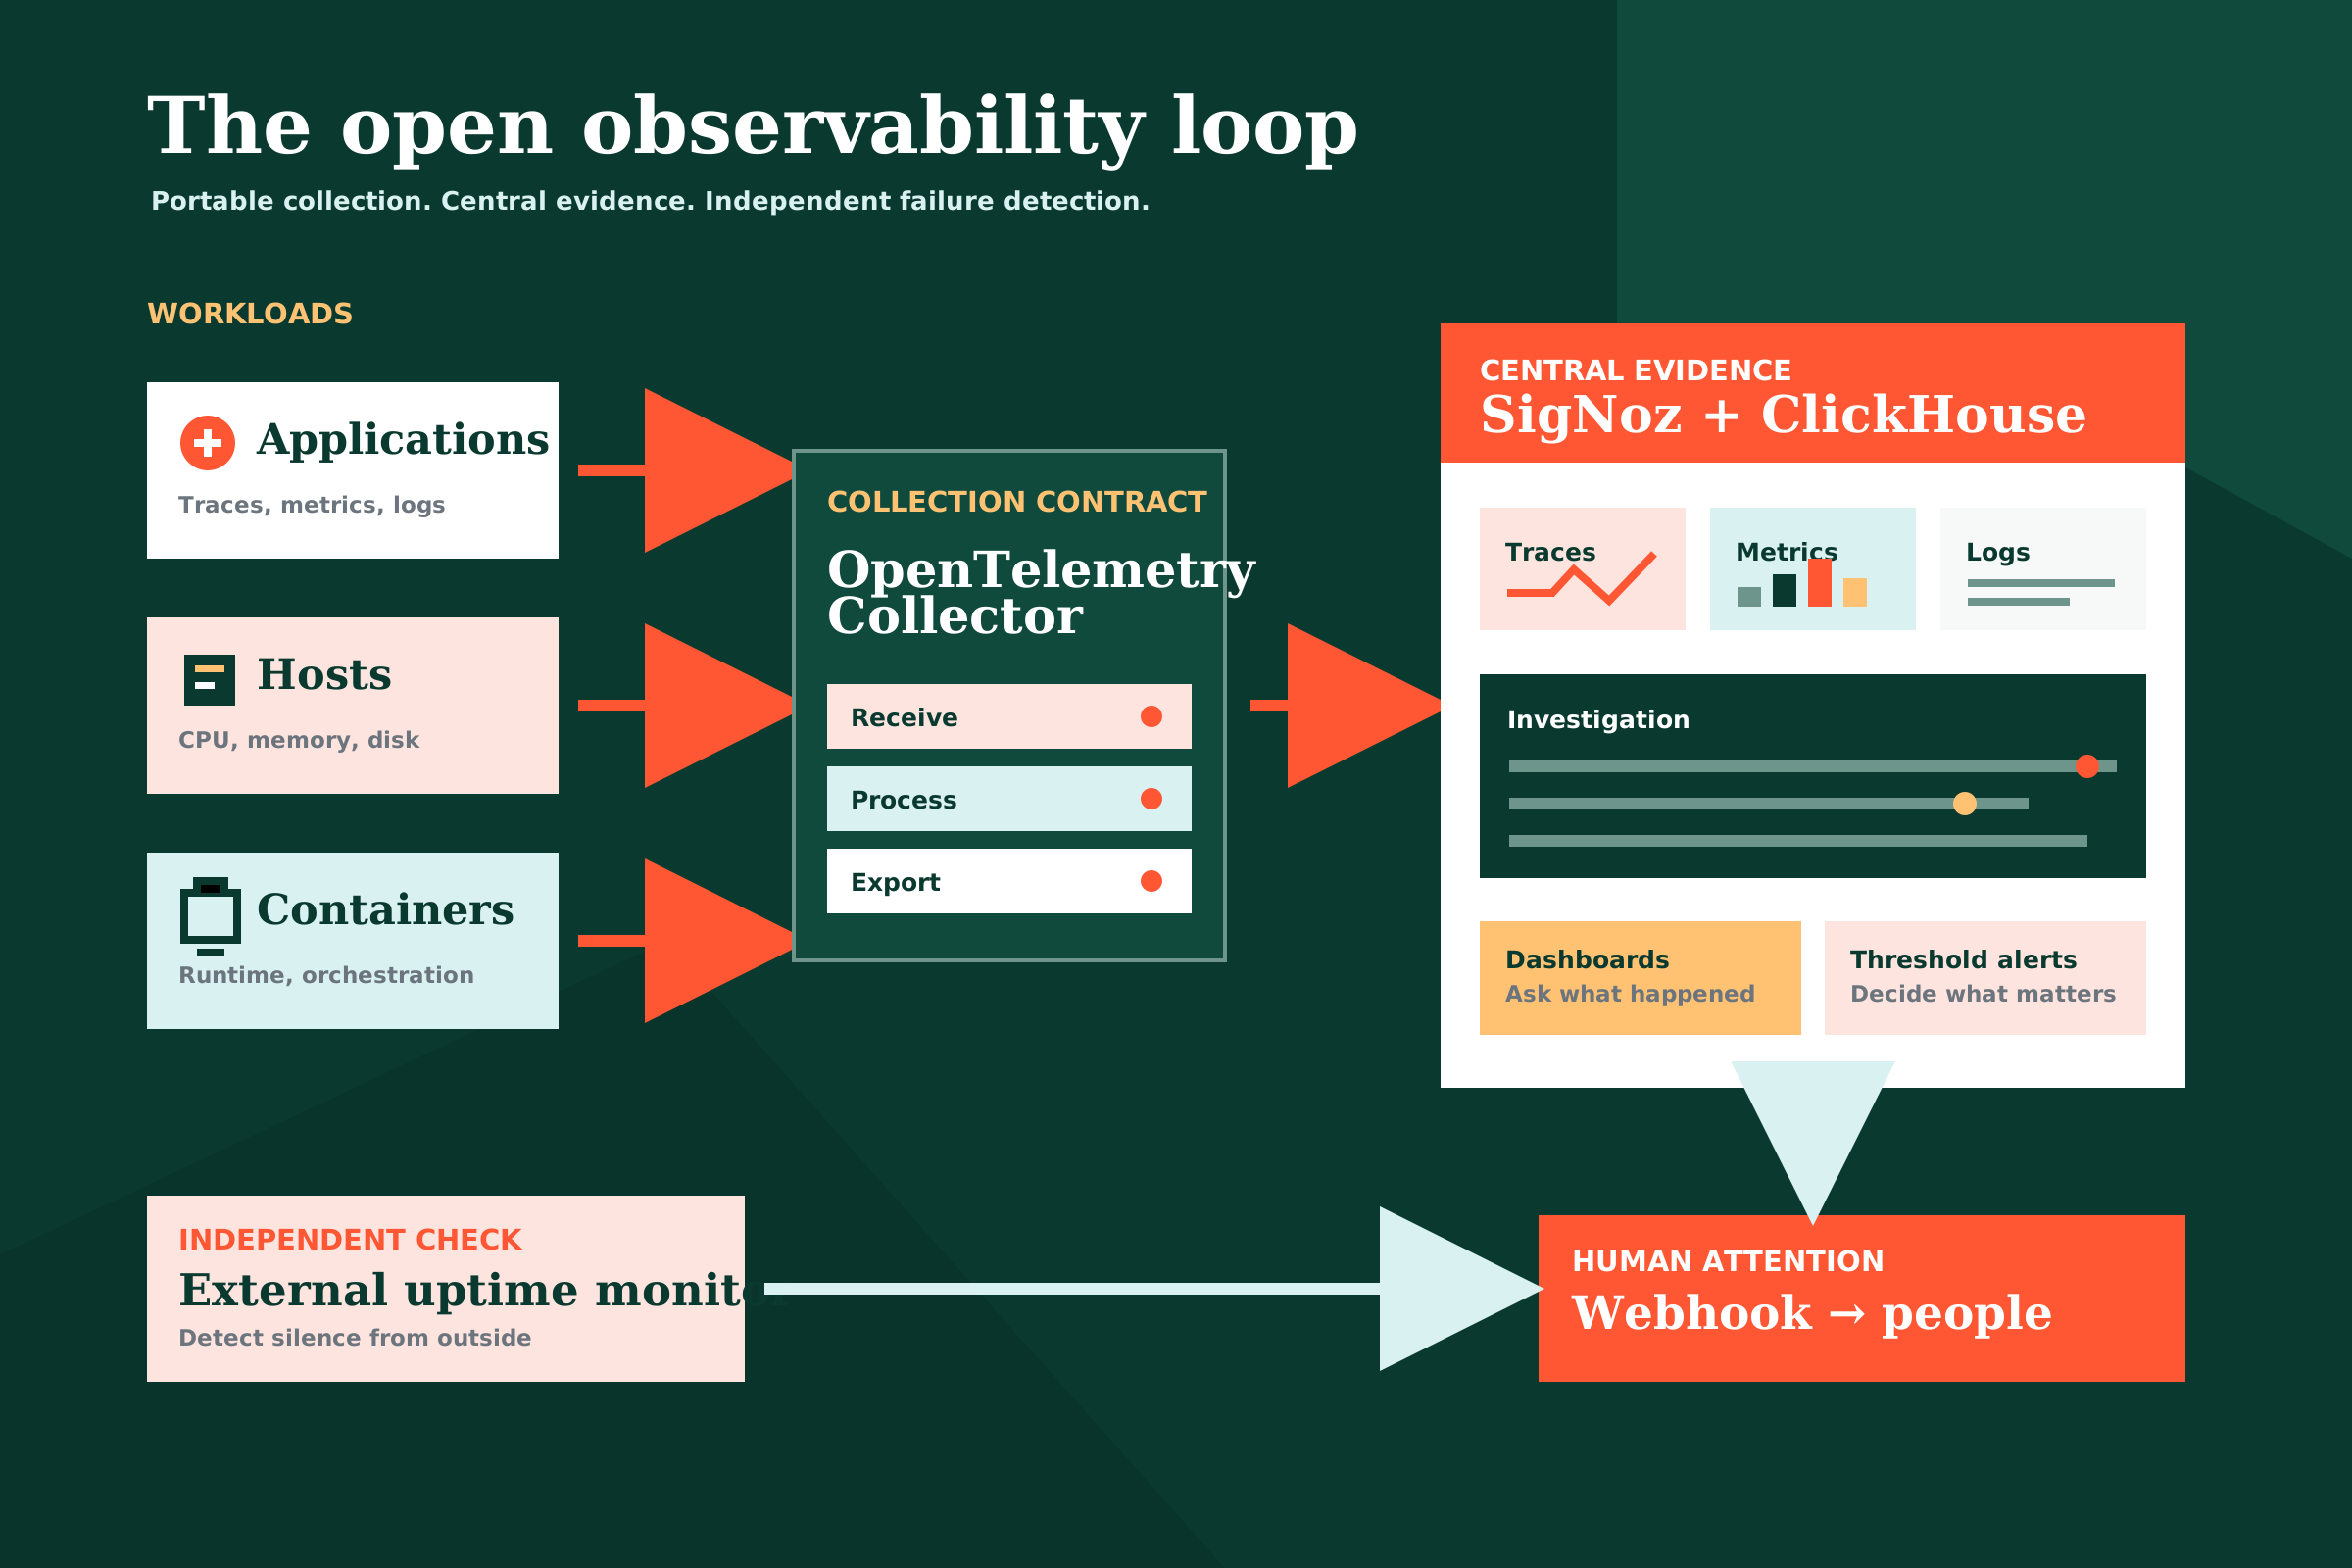
Hosts ────────┼─> nearby OpenTelemetry collectors ─> central SigNoz
Containers ───┘                                      ├─> dashboards
                                                    └─> alert webhook ─┐
                                                                       ├─> people
External uptime monitor ───────────────────────────────────────────────┘
Run the central backend independently from the systems it observes. If the monitoring database shares a machine with an overloaded application, one failure can erase both the product and the evidence needed to diagnose it.
For a modest portfolio, the backend can begin on one dedicated server. Size it according to telemetry volume, retention, and query load rather than user count alone. A quiet application with thousands of users may generate less observability data than a noisy worker processing millions of events.
Make OpenTelemetry the contract
OpenTelemetry is the most important part of the design because it prevents the replacement from becoming another lock-in. It is a vendor-neutral framework for producing and moving traces, metrics, and logs; it is not itself an observability backend.
Applications should emit telemetry through OpenTelemetry SDKs, automatic instrumentation, or compatible logging bridges wherever practical. A Collector receives that data, enriches or filters it, and forwards it to the central platform. The Collector’s architecture is deliberately organized around receivers, processors, and exporters.
Application code -> OpenTelemetry -> Collector -> current backendThe backend can now change without reinstrumenting every application. SigNoz may be the current destination, but the collection contract remains portable.
Each process must identify itself consistently:
service.name=product-api
deployment.environment.name=production
service.version=1.4.2
Independent processes should receive independent service names:
product-web
product-api
product-worker
product-scheduler
Do not put unbounded values such as user IDs, request IDs, or complete URLs into metric labels. High-cardinality labels can turn an inexpensive deployment into a storage and query problem. Keep request-specific values in traces or logs, where they can be searched without multiplying every time series.
Use SigNoz as the central backend
The full Grafana observability stack is powerful, but it is a collection of products: Grafana for visualization, Loki for logs, Tempo for traces, Prometheus or Mimir for metrics, Alloy for collection, and potentially Pyroscope for profiles.
That composability is useful for an established infrastructure team. It is unnecessary operational surface area for many smaller teams.
SigNoz packages the core Datadog-like experience into one OpenTelemetry-native platform:
- application performance monitoring;
- distributed tracing;
- log search and aggregation;
- application and infrastructure metrics;
- exceptions;
- dashboards; and
- threshold alerts.
Its storage layer is ClickHouse, allowing logs, metrics, and traces to live in one columnar system instead of several independently operated backends.
Community Edition covers the core loop described here, including metric-based threshold alerts and webhook notification channels. Do not assume every feature visible in product documentation is part of the unlicensed self-hosted edition: anomaly-based alerts, for example, currently require SigNoz Cloud or Self-Hosted Enterprise.
Keep collection close to the workload
There are two common collection paths:
- Application instrumentation sends OpenTelemetry data to a nearby Collector.
- A Collector or agent on the machine reads host metrics, container statistics, and log files.
The Collector forwards both streams to the central backend.
A nearby Collector gives you a useful control point:
- Applications need to know only a local or private endpoint.
- Telemetry can be batched and compressed.
- Sensitive fields can be removed before transmission.
- Noisy logs can be filtered before they consume storage.
- Temporary backend failures can be retried or buffered within explicit limits.
Direct application-to-backend export is acceptable for a very small deployment. The Collector becomes valuable as soon as several services need the same redaction, enrichment, sampling, or routing policies.
Treat alerts as decisions, not forwarded logs
A message saying that an exception occurred is not an observability system. It is a notification.
The central platform should preserve and correlate the evidence. The notification channel should receive only conditions that require human attention.
Useful alerts include:
- Error rate remains above a threshold for several minutes.
- A critical scheduled job fails or stops running.
- Request latency crosses a service objective.
- Queue depth grows without recovering.
- A service stops producing expected traffic.
- Disk usage threatens the observability backend itself.
Avoid forwarding every raw exception. Group repeated failures into an incident with a count, time window, service identity, and link to the underlying evidence. Otherwise the notification channel becomes noise and is eventually ignored.
The clean division is:
The observability platform stores, groups, and explains the problem. The notification channel gets attention.
SigNoz can send an alert through a generic webhook. That webhook can feed an existing chat bot, incident tool, or custom notification service.
Add monitoring from outside the system
Application instrumentation cannot reliably report that the entire application server has disappeared. The same limitation applies when the Collector or its network path is unavailable.
An external uptime monitor should check critical public endpoints from outside the production failure domain. It should alert independently when:
- a website or API is unreachable;
- a TLS certificate is approaching expiration;
- a health endpoint returns the wrong status;
- response time exceeds a practical limit; or
- the observability dashboard itself becomes unavailable.
Uptime Kuma is a straightforward self-hosted option. Prometheus Blackbox Exporter is a better fit when a Prometheus-based monitoring layer already exists.
This produces three independent layers:
- Instrumentation explains what the application is doing.
- Central observability stores and evaluates that evidence.
- External monitoring detects when the other layers cannot report.
Secure and control the data plane
A self-hosted system owns its security failures as well as its data.
Do not expose telemetry ingestion as an anonymous public endpoint. Prefer a private network. When traffic must cross an untrusted network, require TLS, authentication, and strict firewall rules. Separate administrative access from ingestion access.
Establish explicit policies for:
- data retention;
- ClickHouse backups and restore tests;
- log redaction;
- secrets and personal information;
- maximum log volume per service;
- metric-cardinality limits; and
- access to production traces.
Observability data often contains URLs, database statements, request attributes, and user-related context. Owning the server does not remove the need to minimize what is collected.
Build it in this order
The safest build sequence creates useful coverage early and tests every handoff before expanding:
- Inventory the current system. List the Datadog dashboards, monitors, integrations, retention periods, and notification routes people actually use.
- Deploy the central backend. Use the current SigNoz self-hosting guide on infrastructure outside the applications’ primary failure domain.
- Instrument one representative service. Choose a service with HTTP traffic, background work, and at least one dependency so you can validate traces, metrics, and logs together.
- Put a Collector near the workload. Add resource identity, batching, memory limits, redaction, and explicit retry behavior.
- Add infrastructure telemetry. Collect CPU, memory, disk, container, and orchestration signals that explain whether a failure is in the code or its environment.
- Create a small alert set. Begin with user-visible failure, sustained error rate, latency, missing jobs, queue growth, and backend capacity.
- Connect one notification route. Make every alert include the service, environment, condition, duration, and investigation link.
- Add external checks. Monitor critical public paths and the observability system from another failure domain.
- Cause a controlled failure. Verify collection, storage, correlation, alert evaluation, webhook delivery, and human receipt end to end.
Do not count the platform as operational until the deliberate failure reaches a person with enough context to investigate it.
Migrate without creating a blind spot
Do not replace the old platform in one step. Run both systems while validating coverage.
- Compare logs, traces, metrics, and alerts for the representative service.
- Recreate only actionable dashboards and monitors.
- Expand the OpenTelemetry contract to the remaining services.
- Test host failure, application failure, and missing telemetry separately.
- Reduce Datadog ingestion only after the new path demonstrates parity.
- Remove Datadog after an agreed observation period and a successful restore test for the new backend.
This is also an opportunity to delete monitoring nobody uses. Reproducing years of accumulated dashboards defeats part of the reason to rebuild the system.
What self-hosting does and does not save
Open source removes the vendor’s usage-based bill. It does not make observability free.
The remaining costs are:
- compute;
- storage;
- backups;
- network transfer;
- upgrades; and
- operational attention.
Self-hosting is attractive when telemetry volume makes vendor pricing disproportionate, data control matters, or the team already knows how to operate stateful infrastructure. It is less attractive when nobody will own upgrades, backups, restore tests, and capacity planning.
The correct comparison is not subscription price versus zero. It is subscription price versus infrastructure plus operational responsibility.
The minimum viable open-source Datadog
For most small teams, the complete starting stack is:
OpenTelemetry SDKs
        ↓
OpenTelemetry Collector
        ↓
SigNoz Community Edition
        ↓
Webhook notification channel

External uptime monitor ─> same notification channel
One central installation can serve every application. New services require instrumentation and consistent identity, not another monitoring server.
If continuous profiling, advanced browser replay, or specialized network monitoring later becomes essential, add the narrowest open component that supplies it. Do not begin by reconstructing every Datadog product SKU.
The governing principle is simple:
Standardize collection, centralize evidence, and keep the backend replaceable.
That is enough to build an open-source observability system that replaces the part of Datadog most software teams actually depend on.