Suppose you want to test an outbound campaign for a new product.
The tempting approach is one large prompt:
Find the ideal customers, research their problems, choose the best accounts, write personalized messages, score the campaign, and prepare it to send.
An AI agent can produce all of that. The problem is that the same agent chooses the market, interprets the evidence, writes the claims, and judges whether those claims are good. If its first assumption is weak, every later step can still look polished and coherent.
Graph engineering offers a simpler operating model: split the work into separate jobs and control what moves between them.
Greg Isenberg explains graph engineering through three useful distinctions:
- Prompt engineering: ask a better question.
- Context engineering: give the AI better information.
- Graph engineering: decide which jobs exist, how they connect, and where review or approval must happen.
In plain language, the graph is a workflow map. The boxes are jobs. The arrows are handoffs. Shared state is the short record that moves between them.
For go-to-market engineering, that means moving beyond a chain of tools. The graph must also show how the company forms a commercial belief, challenges it, acts on it, and learns from the market.
The whole graph in one example
Imagine the commercial question is:
Should we offer a paid audit-preparation pilot to security leaders at regional banks?
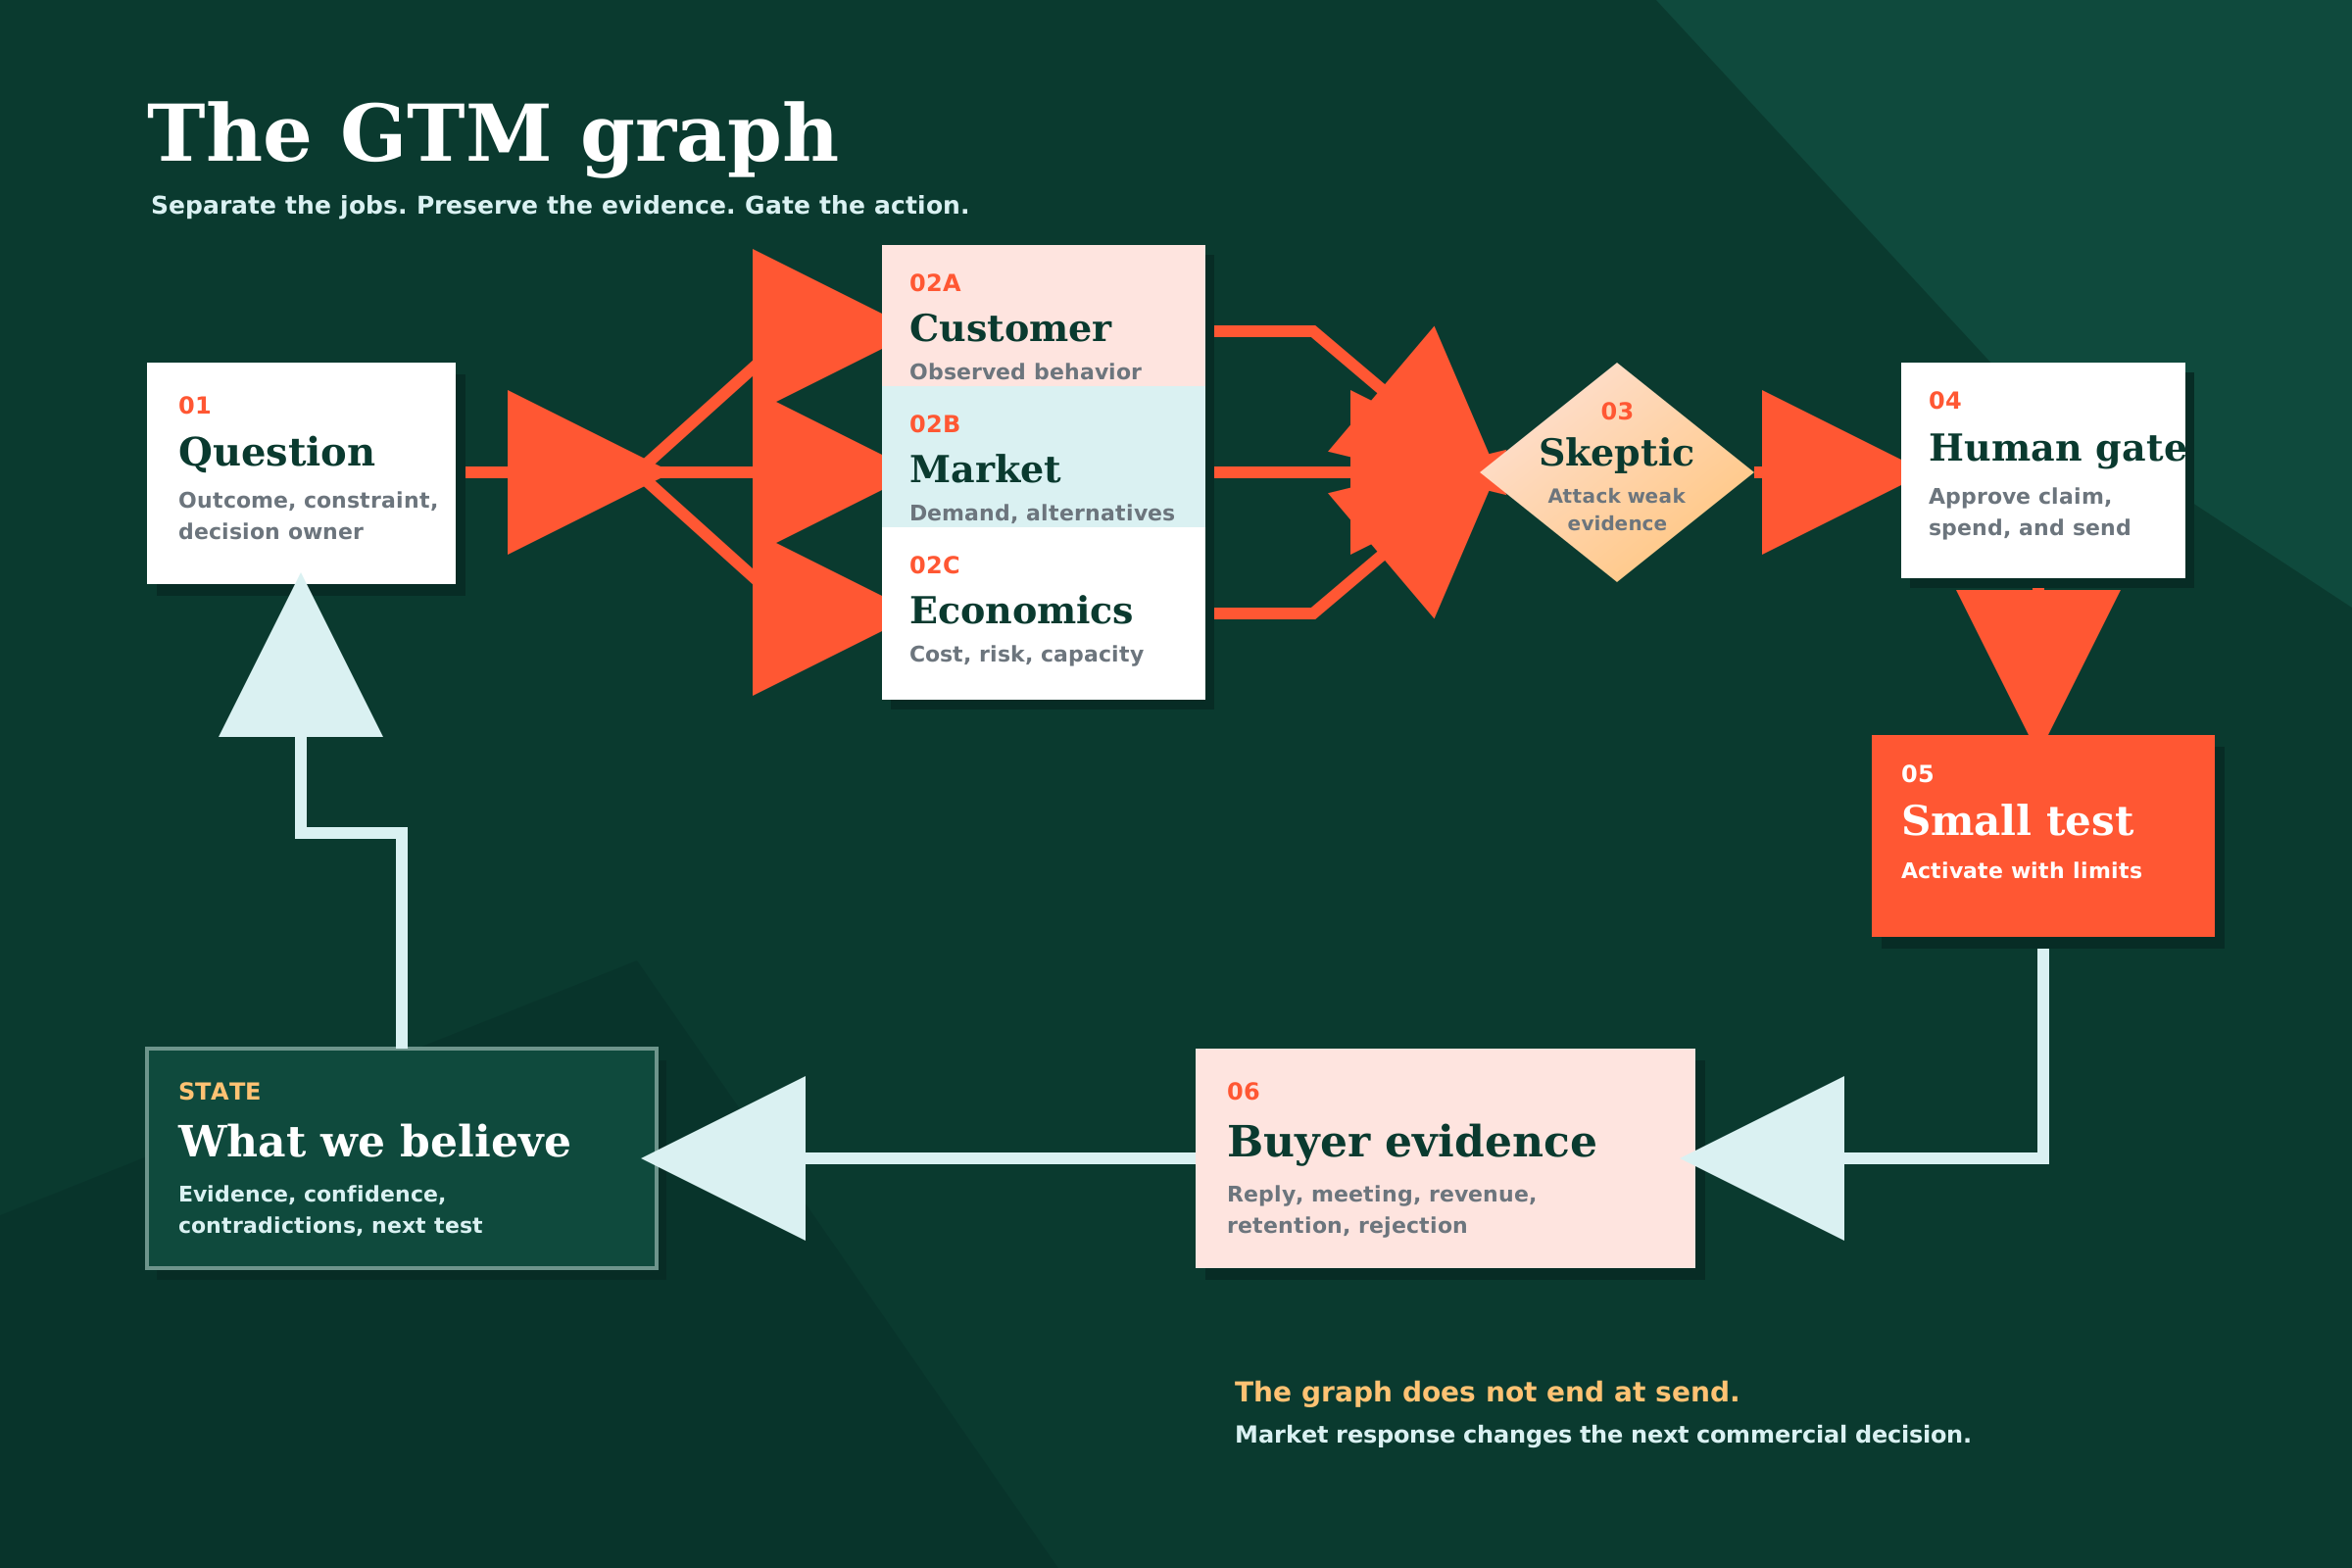
A small GTM graph could work like this:
- Define the decision. State what you are trying to decide and what evidence would support or reject it.
- Research three independent angles. Examine customer behavior, market demand, and the economics of delivering the offer.
- Challenge the evidence and prepare a decision brief. A separate skeptic finds weak claims, then the surviving evidence becomes a recommendation.
- Require human approval. A person approves the audience, claims, budget, sending limit, and stop condition.
- Run the smallest useful test. The graph acts only within the approved limits.
- Record buyer behavior. Replies, objections, meetings, revenue, rejection, and retention update the next decision.
That is the graph. It is not a new name for a sales funnel.
A funnel describes what buyers do. A graph describes how the company does the work.
Step 1: define a decision, not a tool
“Build an outbound agent” is not a useful starting point. It names a tool but leaves the commercial decision undefined.
“Decide whether regional-bank security leaders have enough audit-preparation pain to justify a paid pilot” is better. It names the customer, the problem, and the decision.
The first node should answer five questions:
- What exactly are we deciding?
- What result would justify action?
- What evidence would change our mind?
- What constraints apply to data, budget, brand, and customer contact?
- Who owns the final decision?
This prevents the rest of the graph from efficiently solving the wrong problem.
Step 2: gather evidence in parallel
The first node now branches into three research jobs.
Customer evidence looks for the problem in interviews, sales calls, support conversations, product behavior, won and lost deals, retention, and churn. It reports what people did or said. It does not invent a persona to fill a gap.
In the regional-bank example, it might find that security leaders discuss audit preparation frequently but delegate most of the work to compliance managers. That changes who the buyer may be.
Market evidence examines demand, competitor language, current alternatives, search behavior, communities, and distribution. It asks whether the problem exists outside the company’s own story.
It may find that teams already solve the problem with consultants and spreadsheets. Those are not merely competitors. They reveal what a new offer must replace.
Economic evidence examines willingness to pay, delivery cost, sales-cycle length, service burden, data access, and the company’s ability to fulfill the promise.
The pain may be real while the business remains unattractive. A pilot that requires months of custom work is not automatically a good offer.
These jobs should run independently. If all three begin with the same polished conclusion, parallel research only produces three versions of confirmation.
Step 3: give someone the job of disagreeing
The skeptic receives the research artifacts and tries to break the case.
For this example, the skeptic might ask:
- Did we speak only to people already interested in our product?
- Are we confusing frequent complaints with willingness to pay?
- Does the security leader feel the pain but lack the budget?
- Are consultants a bad workaround or a preferred source of trust?
- Is the proposed message making a claim the evidence does not support?
The skeptic should be a separate node with fresh context. For consequential work, use a different model or a person. At minimum, the writer of the recommendation must not also be its only reviewer.
The point is not to make the workflow argumentative. It is to stop confidence from passing through the graph without resistance.
After the review, the surviving evidence becomes a one-page decision brief. It contains the recommendation, the important contradictions, the proposed test, the cost and risk, and the result that would cause the company to continue, revise, or stop.
Step 4: approve one specific action
A person reviews the decision brief and decides whether the graph may act.
This approval must happen before the workflow contacts customers, spends money, changes pricing, publishes a claim, or writes to a production system. “Human in the loop” means very little if the human arrives after the campaign has already launched.
In the regional-bank example, the approval might authorize a test with 25 accounts, one supported problem statement, no automated follow-ups, and an immediate stop after two spam complaints.
The approval is narrow on purpose. The graph can run the test that was approved, not any campaign it later invents.
Step 5: run the smallest useful test
The graph can now execute within the approved limits. It can assemble the 25-account list, use the approved claim, prepare the messages, and stop at the agreed boundary.
The objective is not to maximize activity. It is to create enough contact with the market to answer the original question without taking unnecessary brand, compliance, or relationship risk.
Step 6: return buyer evidence to the graph
Many GTM workflows stop at send because sending is the last step the company controls.
That is too early.
A send is not evidence of relevance. A reply is not necessarily buying intent. A meeting is not revenue. Revenue is not retention.
The graph should record the outcomes that matter to the original decision:
- positive and negative replies;
- the language buyers use in objections;
- meetings held, not merely booked;
- qualified opportunities;
- revenue and delivery cost;
- opt-outs and complaints;
- continued use or retention.
Those results update the company’s belief. Perhaps compliance managers respond more often than security leaders. Perhaps buyers want audit evidence collection rather than audit preparation. Perhaps the pilot closes but costs too much to deliver.
The next run should begin with that evidence. Otherwise the graph is only an execution pipeline. The return path turns it into a learning system.
Keep one decision record, not every chat
Shared state is not another step. It is the short record every step can read, and it can be one simple document.
Record:
- what the team currently believes;
- which evidence supports it;
- which evidence contradicts it;
- what a human approved;
- what happened in the market;
- what should be tested next.
Do not treat the complete chat history as institutional memory. A future operator needs the reason for the decision, not every sentence generated along the way.
Start with files before automation
There are three practical ways to run the graph.
Manual: draw it on paper or a board. Run each job in a fresh AI session and move the artifacts yourself.
File-based: give every job a named file in a shared directory. This creates clear handoffs and a paper trail without requiring new infrastructure.
Automated: after the workflow has worked several times, use orchestration software for parallel jobs, branches, checkpoints, permissions, and integrations.
The file-based version is usually the best place to begin:
gtm-graph/
  00-question.md
  01-customer-evidence.md
  02-market-evidence.md
  03-economic-evidence.md
  04-skeptic-review.md
  05-decision-brief.md
  06-human-approval.md
  07-results-and-next-step.md
Each file has one job. The skeptic does not erase the original research. The campaign cannot run until the approval file exists. The results are recorded even when the test fails.
You can hand the workflow to a coding agent with an instruction like this:
The commercial decision is: [one sentence].

Create the smallest useful workflow graph for this decision.
Give each node one job and one clearly named file.
Research customer, market, and economic evidence independently.
Use a separate skeptic to challenge the evidence.
Produce a short decision brief for human approval.
Do not contact customers, spend money, or change production data
until the approval file explicitly permits it.
After the test, record buyer behavior and update the next step.
Run the graph manually before automating it. If the separated workflow does not produce a better decision, software will only produce the same confusion faster.
For a repository-wide version, I created the full-cycle product operating graph. It treats observational product intelligence, product development, and GTM as conditional subgraphs, then adds isolated workers, independent skeptics, merger nodes, and human gates around the work.
Use a graph only when it earns its cost
Not every task needs this structure.
A plain prompt is usually enough to rewrite a subject line, summarize a call, clean a field, or format a report.
A graph becomes useful when:
- several independent questions can be researched at once;
- the same workflow will be repeated;
- weak evidence could cause meaningful commercial harm;
- the AI would otherwise grade its own work;
- a human should approve the action before it reaches the market.
Start with one commercial question and the six steps above. Remove any node that does not improve the decision. Add automation only after the handoffs become obvious.
Connect judgment, not only tools
GTM engineering emerged because someone had to make the commercial stack behave like a system. That work still matters.
But a reliable technical workflow can still scale a weak commercial assumption. The more important graph connects the people and jobs responsible for judgment:
Question → independent evidence → skeptic → human approval → small test → buyer evidence → next question.
Prompt engineering can improve each job. Context engineering can improve the information available to it. Graph engineering makes sure no single job gets to define the market, write the campaign, and declare itself correct.
As I argued in “The workflow is free. Judgment is not.”, automation compounds the judgment behind it. A good GTM graph makes that judgment visible before it compounds.
The goal is not a more elaborate automation.
It is a simpler way to earn the right to act.